How do you use the Picotest injectors and the Agilent analyzer to measure output impedance and/or non-invasive step loading?
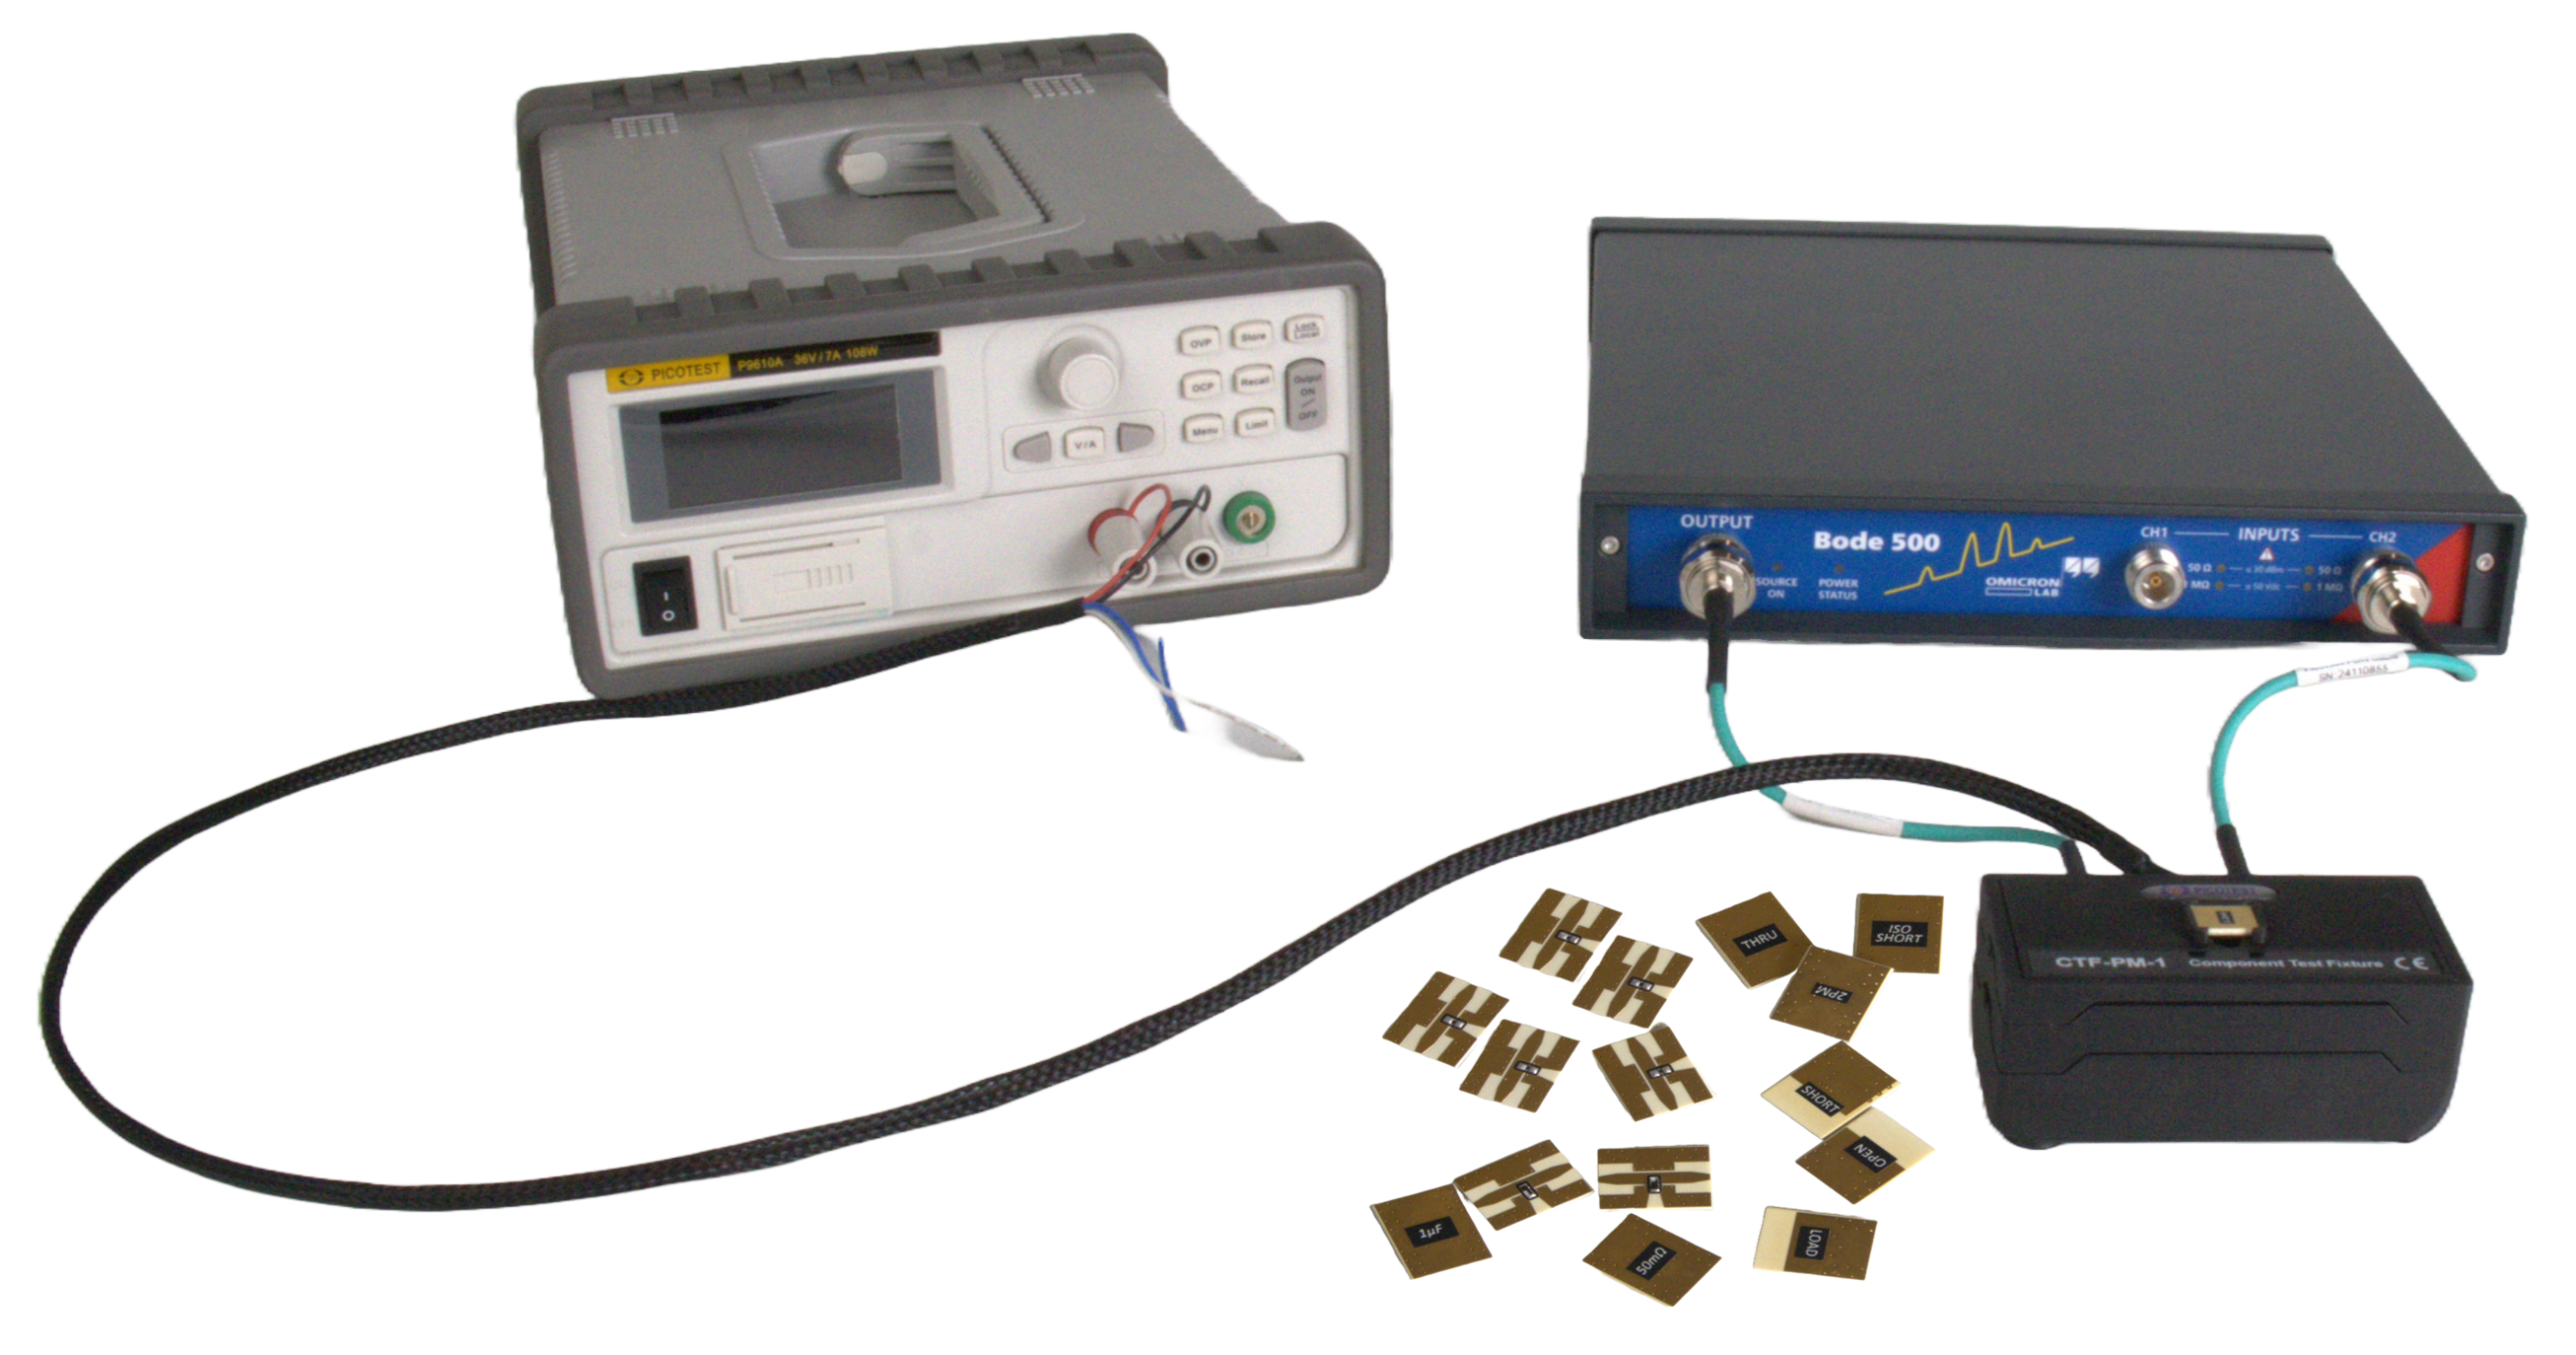
For the output impedance measurement you need to connect the output of the J2111A current injector and a scope probe (preferably 1X for best sensitivity) to the output of the LM117.
You would connect the scope probe to the “T” input (terminated into 1MOhm) and the current monitor from the current injector to the “R” input (terminated into 50 Ohms). The LF Output connects to the modulator input of the current injector. This is all shown below in the connection diagram.
There is also a bias switch on the current injector that needs to be switched to the “+” position for positive regulator measurements.
The sweep frequency should be from 100Hz to 10MHz (I know it says 10Hz in the testing list, but I believe 100 should be acceptable for the low end. Starting at 10Hz will make the sweep much slower) and 0dBm is a good place to start for signal level. I would also recommend using a low receiver bandwidth or IF Frequency (at most 100Hz).
For the number of points per decade in the sweep, I typically use 401. Going higher than that is not a problem, but potentially unnecessary. Should the peak in impedance at the bandwidth of the LM117 be so steep that it appears to be aliased or truncated, increasing the number of points per decade and/or narrowing the frequency sweep span around that peak will help alleviate the problem.
Plot the magnitude (|Z|) and group delay (Tg) on 2 grids since when using 2 traces on the same grid only one axis is displayed at a time (corresponding to whichever trace is selected).
When viewing these traces, you will want to log the y-scale of the magnitude of the impedance and in theory you would log the y-scale of the group delay, but only if you can take the absolute value of the group delay first. This can only be done using a visual basic code based macro. A screen shot and CSV will work fine as the data can be taken from the CSV and placed into Excel or a simulator’s waveform viewer.
To do a small signal load step you would change the modulator from the network analyzer to an AWG and change the bias switch on the current injector from the “+” position to the middle position (no bias current). The scope probe and current monitor would then go to an oscilloscope. Now generate a square voltage pulse with the AWG and this will present itself as a square load pulse at the output of the regulator. The scaling for the AWG voltage to Load current transformation is 100:1, meaning a 0 to 1V pulse would represent a 0 to 10mA load step.
Make sure the current monitor is terminated into 50 Ohms and that the voltage waveform is AC coupled so as to best see the voltage response at the output of the device. I find it easiest to trigger off of the “Sync” output of the AWG, however syncing off of the load current pulse will also work.